
BUSINESS
Hang Seng TECH’s 62% Slide Prices China’s Factory Glut
Hang Seng TECH’s 62.2% fall from its 2021 peak is the price of China’s factory glut, as solar losses and 0.4% retail sales show demand never caught supply.

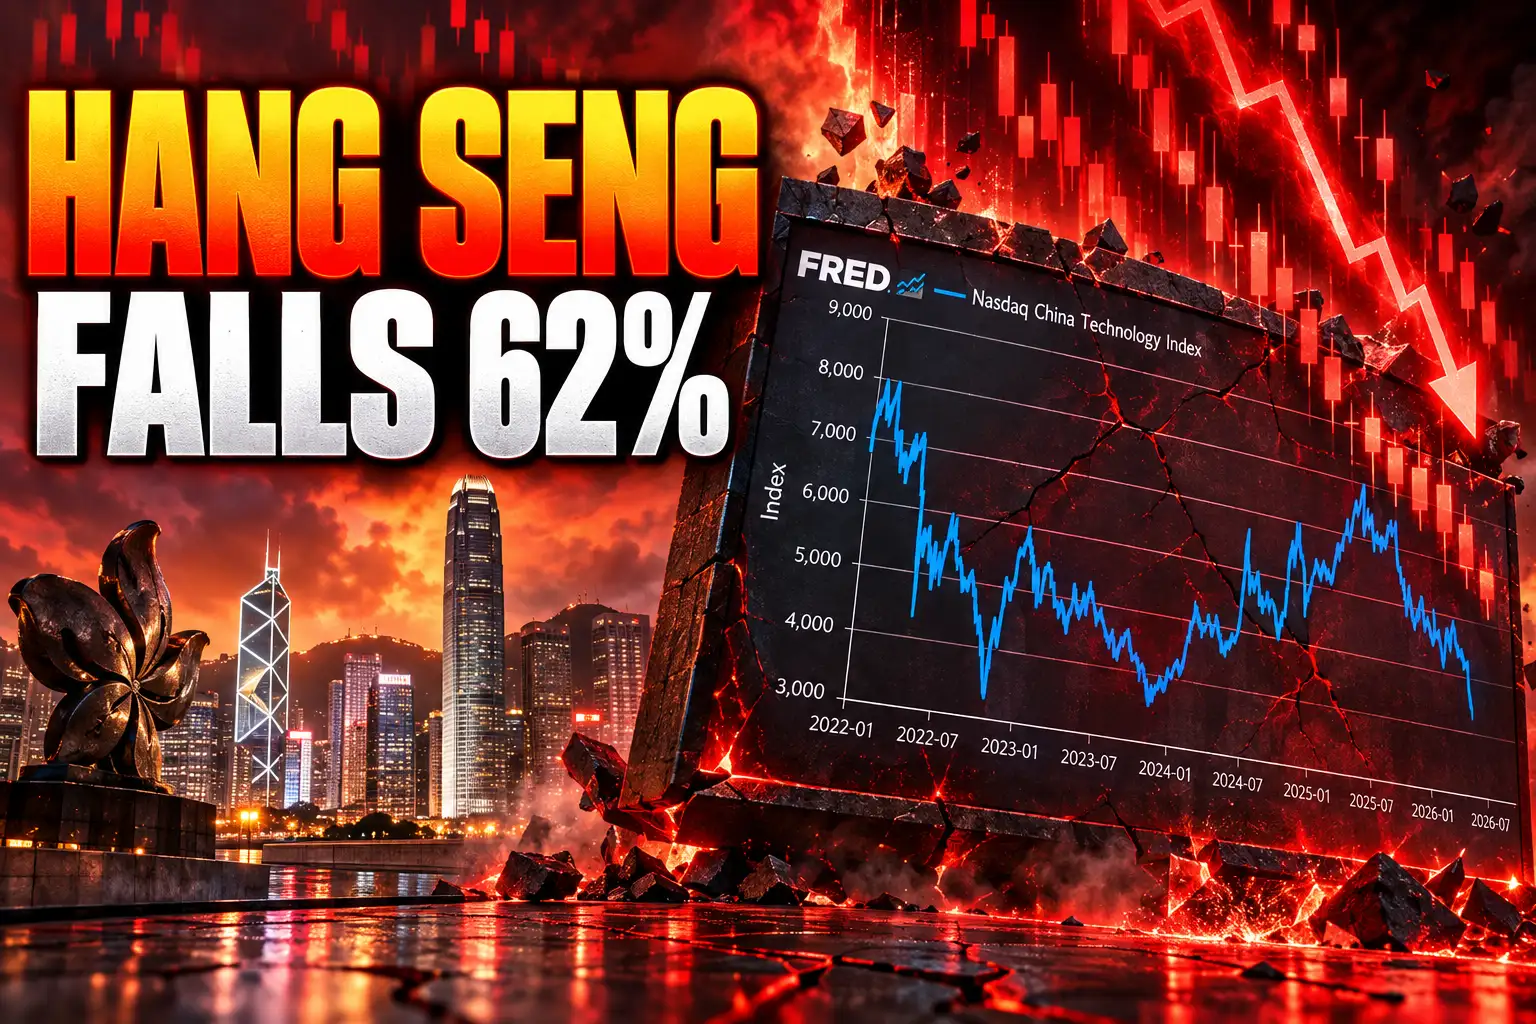
The Hang Seng TECH Index closed at 4,157.94 on Oct. 2, down 62.2% from its February 2021 peak and at a 2026 low. The 30-stock Hong Kong gauge of China’s largest listed tech names fell 2.26% in that session, with mainland markets shut for the National Day holiday until Oct. 8.
Over the same span from mid-February 2021, the S&P 500 rose 96.3% and the Nasdaq Composite rose 92.9%. That gap is the market’s price for a factory system that can make the goods of the next decade and still cannot get paid for them at home.
A 2026 Low for Hang Seng TECH
On Oct. 2, the Hang Seng TECH Index closed at 4,157.94, down 95.95 points from 4,253.89, as Tencent, Alibaba, Meituan, and Xiaomi sold off together. The February 2021 peak was 11,001.78. CSI 300, the mainland large-cap benchmark, peaked at 5,930.91 that same month and remains far below it.
INDEX LEVELS FROM EARLY 2021
| Index | Early 2021 | Oct. 2, 2026 | Change |
|---|---|---|---|
| Hang Seng TECH | 11,001.78 (Feb. peak) | 4,157.94 | -62.2% |
| S&P 500 | 3,934.83 (Feb. 12) | 7,722.72 | +96.3% |
| Nasdaq Composite | 14,095.47 (Feb. 12) | 27,190.86 | +92.9% |
The Nasdaq line uses the Feb. 12, 2021 close, when that index set a record, against the Nasdaq Composite close of 27,190.86 on Oct. 2. The S&P 500 closed at 7,722.72 the same day. Chinese listed tech did not merely trail those gauges. It ran in the opposite direction, and a 2025 bounce in Hong Kong tech was given back in 2026.
State Policy Built More Plants Than Buyers
Beijing’s industrial planners spent the past decade steering capital and talent toward chips, AI, electric vehicles, solar, and other “hard tech,” and they treated consumer platforms as a diversion. At the height of Covid, regulators hit Alibaba, Tencent, and other consumer-internet groups over data, finance, and monopoly power. The enforcement wave later eased. The preference for plants over household spending did not.
Local governments sweetened the shift with cheap land, cheap credit, and tax breaks, so capacity arrived in clusters that now compete mainly on price. Barriers abroad then narrowed the export valve that was supposed to absorb the extra output. Listed shareholders sit on the equity of those plants, which is why a manufacturing lead and a 62.2% drawdown can be the same policy, seen from two sides of the balance sheet.
Property tightening from 2021 stripped a second store of household wealth at the same time. Families who had treated flats as savings found both their homes and their brokerage apps marked down, and that combination still shows up in the shops.
150 Solar Exits Since 2024
Solar is the cleanest specimen of the trap. A Black Hawk PV tally of 139 firms shows 220,414 jobs gone between the end of 2023 and the end of 2025. LONGi Green Energy cut its headcount from 75,000 to 32,800. More than 150 firms have gone bankrupt or entered liquidation since 2024, well beyond the 40-firm count that circulated earlier in the shakeout.
SOLAR CHAMPIONS IN THE FIRST HALF OF 2026
- LONGi: First-half revenue of 27.05 billion yuan, down 17.6%, and a net loss of 3.68 billion yuan, 43.4% wider, with operating cash outflow of 5.82 billion yuan.
- TCL Zhonghuan: Revenue of 14.31 billion yuan, up 6.8%, and a net loss of 3.20 billion yuan, 24.5% narrower.
- Daqo New Energy: Revenue of 623 million yuan, down 57.6%, and a net loss of 1.60 billion yuan, with polysilicon sold below cash cost.
- GCL Technology: Attributable net loss of 2.08 billion yuan, 17.2% wider, even though its average selling price still sat above cash cost.
- The streak: Tongwei, LONGi, and TCL Zhonghuan have now posted 10 consecutive quarters of net losses.
Daqo’s first-half sheet is the glut in one line. The firm produced 87,077 metric tons of polysilicon and sold 19,672 tons, at 30.63 yuan a kilogram against a cash cost of 34.75, and it booked about 1.03 billion yuan of inventory write-downs. GCL still cleared 31.97 yuan a kilogram against a 25.23 cash cost, which is survival, not a boom. Combined 2025 losses at the leading names topped 50 billion yuan.
LONGi still shipped 29.93 GW of modules in the first half, and overseas markets supplied more than 65% of module revenue, with foreign module sales up more than 26%. Volume is not profit when the world already has more panels than it will install at a price that covers capital. MIIT official Wang Shijiang said in February the industry was in a deep adjustment and that curbing excessive competition was the priority. The losses kept coming through June.
Polysilicon Sold Below the Cash Cost
Power markets now rhyme with the panel chain. Wind and solar parks that were a license to print cash when tariffs were fat have been meeting falling power prices and grid curtailment, and some hours have gone to negative prices because the electricity has to be used the instant it is made. Storage hiring is rising on the back of that surplus and of weather-dependent generation, which is another industrial patch, not proof that households want more goods.
EV list prices moved up into 2026 as costs rose and Beijing pushed back against endless discounting, yet domestic sales still softened, so a ceasefire on stickers has not restored demand. The plants remain. The buyers do not.
How Households Paid for Cheap Exports
The cheap panel and the cheap car were never free. A large share of national income is steered into investment, households save at low returns, and the listed vehicles that were supposed to compound that savings, consumer platforms and now “hard tech,” have been a wealth drain instead.
some of the subsidy embedded in the cheap solar panels is indirectly financed by Chinese households accepting lower living standards than they otherwise might enjoy.
Izabella Kaminska, editor of The Blind Spot, on X
That bill showed up as capital flight, then as a regulatory lock. A hot-money gauge put unauthorized 2025 outflows at $1.04 trillion, the largest annual reading since 2006. On May 22 the China Securities Regulatory Commission, working with seven other agencies under State Council approval, moved against unlicensed offshore brokerages, fined Futu, Tiger Brokers, and Longbridge a combined $330 million, and ordered illegal mainland accounts wound down over two years, sell-only. Citic Securities estimated as much as HK$250 billion of Hong Kong assets could be touched.
THE BILL FROM 2021 TO AUGUST 2026
- 2021: Regulators hit leading consumer-tech groups, and property controls tightened on developers, cutting two pillars of household wealth.
- 2025: Unauthorized outflows reach $1.04 trillion on the hot-money gauge, the largest annual print since 2006.
- May 22, 2026: The CSRC and seven other bodies open a two-year crackdown on illegal cross-border trading, with $330 million in fines.
- August 2026: Official retail sales rose 0.4 percent in August, while motor-vehicle sales fell 18.5%.
- Oct. 2, 2026: Hang Seng TECH closes at 4,157.94, 62.2% below its February 2021 peak, with mainland boards still on holiday.
The National Bureau of Statistics put August retail sales at 3,982.4 billion yuan. Sales excluding cars rose 2.5%, which means the auto pit dragged the headline down. Urban sales crawled 0.2%. Furniture fell 7.9% and building materials 11.8%, the property hangover in the shopping basket. Telecommunication equipment jumped 27.3% on trade-in support, a subsidy spike, not a broad reopen of wallets. For January to August, retail sales were 32,756.9 billion yuan, up 1.1%.
The Split in August’s Price Data
Headline inflation is no longer a straight deflation story, and that is the trap in a new form. Official data show consumer prices rose 0.8 percent in August from a year earlier, after 0.5% in July, and 0.4% from July. Core CPI, excluding food and energy, rose 1.0%. From January to August, CPI averaged a 0.9% gain.
Dong Lijuan, chief statistician in the NBS urban surveys department, tied the bounce to international market prices and a seasonal lift in food, and she noted energy prices as a driver. Food still fell 1.4% year on year, pork dropped 11.8%, and residence prices slipped 0.3%. The shopper’s basket is not overheating.
THE AUGUST PRICE SPLIT
- Headline CPI: Up 0.8% year on year, with a 0.4% rise from July.
- Core CPI: Up 1.0% once food and energy are stripped out.
- Headline PPI: Factory-gate prices up 3.8% year on year and 0.4% from July.
- Consumer-goods PPI: Still down 0.5% year on year, even as means of production rose 5.0%.
Producer prices for industrial products rose 3.8% in August, and 2.0% on average from January to August, after a long stretch in negative territory that broke earlier in the year when energy and metals jumped. Mining and quarrying prices were up 17.8% year on year. Auto manufacturing was among the industries pulling the producer index down. Imported fuel can lift the factory gate while the goods families actually buy at that gate keep getting cheaper, which is overcapacity with a commodity overlay, not a demand rebound.
Productivity Revisions Do Not Rescue Listed Tech
If “new productive forces” were transforming the whole economy, total factor productivity, the extra output after adding machines and workers, should be running hot. The newest Penn World Table productivity accounts, version 11.0, hosted by the University of Groningen and carried on the St. Louis Fed’s FRED database, show a milder slowdown than older studies claimed, and they still show a slowdown.
China’s TFP index at constant national prices rose from 0.811 in 2013 to 1.014 in 2023, a 24.9% gain over 10 years, or 2.25% a year. From 1992 to 2012 the same series compounded at 3.6% a year. Relative to the United States, China’s TFP level was 0.47 in 2023, with the US set at 1. The country is more efficient than it was. It is less of a productivity rocket than it was during the long reform surge, and property plus old infrastructure still dominate activity compared with the new industries that win the speeches.
WHERE ESTIMATES DISAGREE
- Penn World Table 11.0: After switching to official national accounts, it puts China’s TFP growth at 2.3% a year from 2009 to 2019, ranking sixth globally, and among the top three over the decade to 2023.
- Earlier Wu-based tables: Previous Penn World Table vintages that used Harry Wu’s alternative GDP series showed TFP shrinking or crawling in the 2010s, which fed the “under 2% and distinctly average” reading.
The friendlier 11.0 figures do not recapitalize Hang Seng TECH. A middle-income economy can log 2.25% TFP growth and still run too many solar lines, too many car plants, and too little household demand, and the equity market is pricing that mix, not a methodology debate in Groningen.
Why Consumption Still Lags the Factories
The policies that would lift consumption for more than a season, higher social outlays in the countryside and a genuine hukou reform so migrant families can spend like locals, have been discussed for more than a decade and have not arrived in a form that shows up in the till. Trade-in subsidies can spike telecom shelves for a few months. They do not replace a weaker property asset or a brokerage account that is 62.2% below the last mania.
Anti-glut campaigns can force list prices up and push the weakest mills out. They cannot create the missing buyer. China has shown it can build globally competitive capacity in EVs, solar, rail, and robots, and its large language models now sit in the same conversation as Western ones. It has not shown it can create a matching appetite for what those plants produce, which is why the Hang Seng TECH Index can close at 4,157.94 while the factories keep running.
Mainland boards are due to reopen on Oct. 8. The Hong Kong close of 4,157.94 will still be on the tape when they do.
Disclaimer: This article is news reporting and analysis of market indexes, official statistics, and company results, and it is for information only. It is not investment advice, a recommendation to buy or sell any security, index fund, or commodity, and it is not a forecast of future returns. Readers should consult a licensed financial adviser or investment professional who understands their objectives and risk limits before acting on any figure cited here. Index levels, inflation prints, retail sales, and company losses reflect the sources available as of the dates named in the piece and can change with the next session or the next statistical release.

The Court Revisits the Climate Nuisance Door It Left Open

ChatGPT Now Compiles Live Interfaces With GPT-6

A Tanker Attack Moves the War Into Qatar’s Waters

Personio Buys Circula to Own the DATEV Channel

Bluesky Files for .bsky and Enters the Registry Queue

Musk’s $914 Billion Lead Is a Public SpaceX Bet

Microsoft’s 96% Cyber Score Sits at 86.3% on the Board

Endgame Encore’s $86 Million Trial for Infinity Vision

Free Live Sports Streaming in 2026: What to Watch Without Cable

Andrew Garfield’s Spider-Man Films Are No Longer Free
-
 BUSINESS4 months ago
Musk’s $914 Billion Lead Is a Public SpaceX Bet
-
 NEWS2 months ago
Microsoft’s 96% Cyber Score Sits at 86.3% on the Board
-
 SPORTS3 months ago
Free Live Sports Streaming in 2026: What to Watch Without Cable
-
 ENTERTAINMENT3 months ago
Endgame Encore’s $86 Million Trial for Infinity Vision
-
 ENTERTAINMENT2 years ago
Andrew Garfield’s Spider-Man Films Are No Longer Free
-

 NEWS4 months ago
Singapore’s 3×3 and Surfing Debuts Miss the Medal Stand
-

 ENTERTAINMENT1 month ago
Sterling Point Holds No. 2 on Prime Video After 32 Days
-

 NEWS6 months ago
White Sands Footprints Put People in Ice Age New Mexico