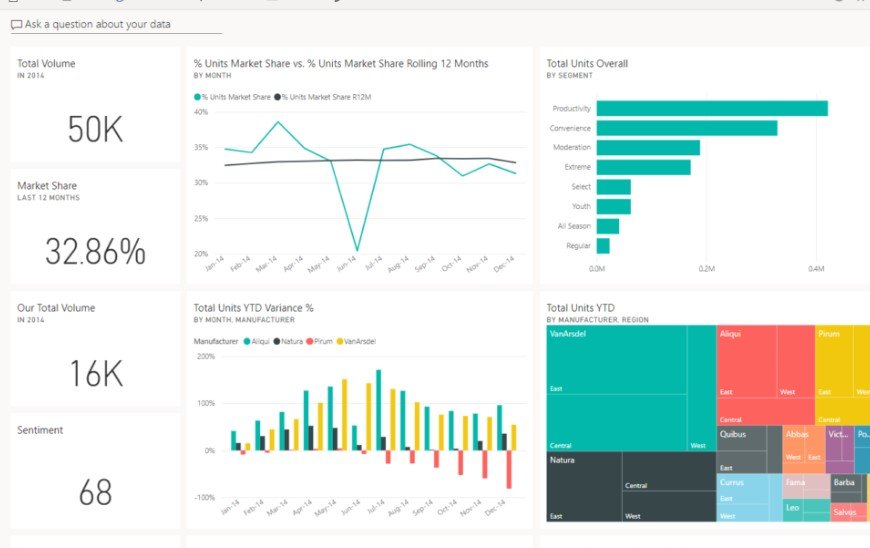
Business leaders across industries are turning to automation to boost efficiency and cut costs, but measuring its true impact remains a challenge. In 2025, experts highlight 16 key metrics that reveal how well automation drives real results, based on recent insights from tech firms and industry reports.
Why Metrics Matter in Business Automation
Automation tools promise faster processes and fewer errors, yet without clear metrics, companies risk wasting resources. Recent studies show that firms tracking specific indicators see up to 30 percent higher returns on their automation investments.
This approach helps identify wins and gaps early. For instance, a 2025 report from a leading project management platform notes that balanced scorecards, which include multiple metrics, prevent strategic failures in nine out of ten cases.
Many businesses start with basic tracking but evolve to advanced KPIs. These metrics align with goals like growth and customer satisfaction, making automation a strategic asset rather than just a tech upgrade.
Core Efficiency Metrics to Monitor
One essential metric is Time Savings, which measures hours freed up by automation. Experts say this directly ties to productivity gains, with some firms reporting 20 percent more output after implementation.
Another is Error Rate Reduction, tracking mistakes before and after automation. In fleet management, this has led to safer operations and lower repair costs.

Throughput, or the volume of tasks completed, balances speed with quality. When paired with stability checks, it ensures automation does not sacrifice accuracy for volume.
Cycle Time Reduction streamlines operations by shortening task durations. Businesses using this metric often spot bottlenecks quickly, leading to smoother workflows.
Customer-Focused Metrics for Better Engagement
Contact Rate stands out for sales and marketing teams, showing the percentage of successful interactions. Recent campaigns have used this to optimize call times, boosting engagement by 15 percent in evening slots.
Sales Cycle Duration measures how automation speeds up deals from lead to close. Shorter cycles mean faster revenue, with data from 2025 showing tech firms cutting this by weeks through automated follow-ups.
Customer Satisfaction Scores rise when automation handles routine queries well. Tracking this alongside response times helps refine AI tools for better service.
Order Processing Time directly impacts satisfaction. Faster handling leads to happier clients and repeat business, as seen in retail automation successes.
Financial and ROI Metrics That Count
Return on Investment (ROI) quantifies automation benefits against costs. A 2025 analysis reveals that firms focusing on this metric recover investments in under a year.
Cost Reduction tracks savings from automated processes. This includes lower labor expenses and fewer errors, often yielding 25 percent cuts in operational budgets.
Productivity Boost measures output per employee. Automation experts note this metric highlights creative time gains, allowing teams to focus on innovation.
- Time-to-Action: Speeds up decision-making in fast-paced environments.
- Free Time: Encourages innovation by reducing mundane tasks.
- Revenue Velocity: Ties automation to quicker sales and growth.
Operational Metrics for Long-Term Success
Human Intervention Rate uncovers when automation needs human help, revealing hidden issues. Low rates indicate robust systems, while high ones signal areas for improvement.
Task Completion Time helps prioritize projects by showing efficiency gains. Bottlenecks become clear, guiding better resource allocation.
Correction-to-Completion Ratio spots friction in processes. This metric has helped companies reduce rework by 40 percent in recent automation rollouts.
| Metric | Description | Typical Impact |
|---|---|---|
| Failure Rates | Tracks automation breakdowns | Improves efficiency by addressing weak points |
| Quality Stability | Ensures consistent output | Balances speed with reliability |
| Deviation Rate | Measures process variations | Enhances compliance and standards |
| Compliance Rate | Monitors regulatory adherence | Reduces legal risks in automated systems |
Insights from Industry Experts
Experts emphasize embracing metrics like Failure Rates to refine automation. One leader shared how tracking this improved overall efficiency by pinpointing recurring issues.
Another focuses on Time-to-Completion paired with quality checks. This dual approach has accelerated processes without quality drops in manufacturing.
In service sectors, metrics like Throughput with Quality Stability maintain high standards. These insights, drawn from 2025 discussions, show automation succeeds when metrics guide adjustments.
Balancing quantitative data with qualitative feedback ensures comprehensive evaluation. For example, employee surveys alongside metrics like Free Time reveal morale boosts from automation.
Emerging Trends in Automation Metrics for 2025
With AI advancing, new metrics like AI Agent Performance are gaining traction. These focus on impact over activity, such as revenue lift from automated workflows.
Sustainability metrics now track energy savings from automation, aligning with green business goals. A recent post from industry leaders highlights how these tie into long-term profitability.
Multi-dimensional measurement, including leading and lagging indicators, provides a full picture. Businesses adopting this see sustained growth, as per 2025 reports.
As automation evolves, metrics must adapt. Experts predict a shift toward predictive analytics, forecasting issues before they arise.
What metrics have you used to measure automation success in your business? Share your thoughts in the comments below and spread this article to help others optimize their strategies.


